Plotting#
Here we describe some subtleties about plotting with python.
Matplotlib#
Matplotlib is the most widely used plotting library available with python and should probably be your first choice, especially if you need to make high quality two-dimensional plots. You can do almost anything you want, and can tweak the output to satisfy any needs for publication (e.g. choosing fonts, vector verses raster graphics, including LaTeX math). In addition, you will probably find examples about how to do these things in 95% of the cases with a simple internet search.
The downside is that Matplotlib can be slow, and can take a lot of code to implement these tweaks. (I budget a solid day of work to get plots ready for publication.) It also has very rudimentary support for 3D plotting: if you need to interact with 3D data, look to other tools like PyVista or MayaVi.
Here we present some tips for using Matplotlib.
Jupyter Notebooks#
There are a few
ways
to get plots working in a Jupyter Notebook. I generally recommend using the %pylab inline --no-import-all magic, (but also checkout the %pylab notebook magic if you use
notebooks which provides some interactivity.)
I also recommend you create a figure and axes with
plt.subplots()
which allows you to create an array of plots. With the axes, you can then easily add
labels, etc.
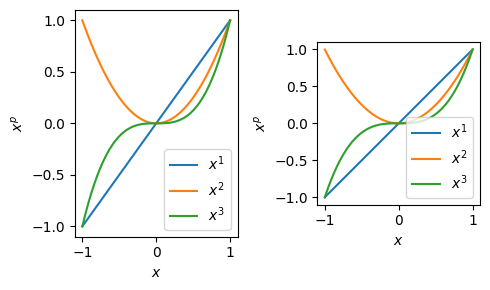
%matplotlib inline
import numpy as np, matplotlib.pyplot as plt

x = np.linspace(-1, 1)

fig, axs = plt.subplots(1, 2, figsize=(5, 3))
for ax in axs:
    for p in [1, 2, 3]:
        ax.plot(x, x**p, label=f'$x^{p}$')
    ax.legend()
    ax.set(xlabel='$x$', ylabel='$x^p$')
axs[1].set(aspect=1)  # Needed to properly display angles etc.
plt.tight_layout()  # Adjust axes so they don't collide.
plt.show()  # Not strictly needed, but see below.
LaTeX#
You will notice that I am using “LaTeX” to format labels in the previous plot. I am not actually using LaTeX, but Matplotlib’s mathtext. This is much faster, but not as flexible as actually using LaTeX.
For publications, you may need to actually use LaTeX. You can do this by creating a
plot context. One subtlety is that you must call plt.show() in the context. This
is good practice in general (see
issues 13431 and
17931 for example).
Here is an example of defining a custom preamble and style:
%matplotlib inline
import numpy as np, matplotlib.pyplot as plt
latex_preamble = r"""
\newcommand{\bra}[1]{\vert #1 \rangle}
\newcommand{\ket}[1]{\langle #1 \vert}
\newcommand{\braket}[1]{\langle #1 \rangle}
""".replace("\n", "") # Strip out newlines
# Here we calculate the exact figure width for a single
# column figure in an APS Physical Review journal. This
# will ensure that fonts will be the correct size.
columnwidth_pt = 246.0 # From LaTeX \showthe\columnwidth
inches_per_pt = 1.0 / 72.27
width = inches_per_pt * columnwidth_pt
golden_mean = (np.sqrt(5) - 1) / 2
plot_style = {
"text.latex.preamble": latex_preamble,
"text.usetex": True,
"figure.figsize": (width, golden_mean*width),
}
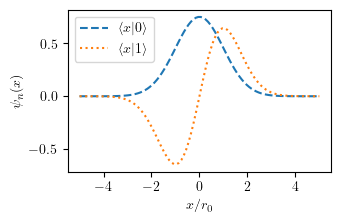
x = np.linspace(-5, 5, 100)
psi0 = np.exp(-x**2/2)/np.pi**(1/4)
psi1 = np.sqrt(2) * x * psi0
with plt.style.context(plot_style, after_reset=True):
fig, ax = plt.subplots()
ax.plot(x, psi0, ls='--', label=r"$\braket{x|0}$")
ax.plot(x, psi1, ls=':', label=r"$\braket{x|1}$")
ax.legend(loc='best')
ax.set(xlabel='$x/r_0$', ylabel=r'$\psi_{n}(x)$')
plt.show() # MUST be inside the context.
Some important points:
LaTeX math must appear between dollar signs
$in your labels.If you have backslashes in your strings, you need to either escape them, or use raw strings. Thus:
"$\\newcommand{\\I}{\\mathrm{i}}$"orr"$\newcommand{\I}{\mathrm{i}}$".When using contexts, you must call
plt.show()inside the context. See issues 13431 and 17931 for example).The
rcParam["text.latex.preamble"]parameter is not officially supported, but extremely powerful. When things go wrong, you will probably need to look in the generated*.texfile (located in~/.matplotlib/tex.cache/*.texon my Mac) to see why LaTeX is having issues.LaTeX Failure Example
For example, if you do not call
plt.show()in the context, the LaTeX will likely fail with an error message like this:--------------------------------------------------------------------------- CalledProcessError Traceback (most recent call last) ... CalledProcessError: Command '['latex', '-interaction=nonstopmode', '--halt-on-error', '/Users/mforbes/.matplotlib/tex.cache/a24b175253e506052ac2ac5a51792273.tex']' returned non-zero exit status 1. ... RuntimeError: latex was not able to process the following string: b'$\\\\braket{x|0}$' Here is the full report generated by latex: ... ! Undefined control sequence. <recently read> \braket l.19 {\sffamily $\braket {x|0}$} ...Inspecting the file
/Users/mforbes/.matplotlib/tex.cache/a24b175253e506052ac2ac5a51792273.texshows no sign of the preamble where we defined\braket. This is because the figure is actually created after the context is closed, and thercParamshave been reset. Thus, when LaTeX is actually called, the preamble no longer has our customizations.The
rcParam["text.latex.preamble"]must be a string on a single line. This behaviour changed in 3.3.0.
Further Reading#
Software Carpentry: Plotting in Python: A short (15min) draft [Software Carpentry] topic about plotting with Matplotlib.